16 Grouping columns with dplyr
author: Юрій Клебан
Before start load packages
16.1 group_by() + summarise()
group_by(.data, ..., add = FALSE) returns copy of table grouped by defined columns.
Let’s find average by lifeExp for each continent in 2002 (ouput is continent, lifeExpAvg2002, countriesCount, year = 2002):
gapminder |>
    filter(year == 2002) |> # year
    group_by(continent) |> # grouping condition, you ca
    summarise(
        lifeExpAvg2002 = mean(lifeExp),
        countriesCount = n() # n() count of rows in group
) | continent | lifeExpAvg2002 | countriesCount |
|---|---|---|
| <fct> | <dbl> | <int> |
| Africa | 53.32523 | 52 |
| Americas | 72.42204 | 25 |
| Asia | 69.23388 | 33 |
| Europe | 76.70060 | 30 |
| Oceania | 79.74000 | 2 |
Let’s find total population for each continent in 2002 (ouput is continent, totalPop, year):
gapminder |>
    filter(year == 2002) |> # year
    group_by(continent, year) |> # grouping condition
summarise(totalPop = sum(pop), .groups = "keep") | continent | year | totalPop |
|---|---|---|
| <fct> | <int> | <dbl> |
| Africa | 2002 | 833723916 |
| Americas | 2002 | 849772762 |
| Asia | 2002 | 3601802203 |
| Europe | 2002 | 578223869 |
| Oceania | 2002 | 23454829 |
There are additional variations of summarise():
16.1.1 Task on Credits (rewrite it)
library(ISLR)
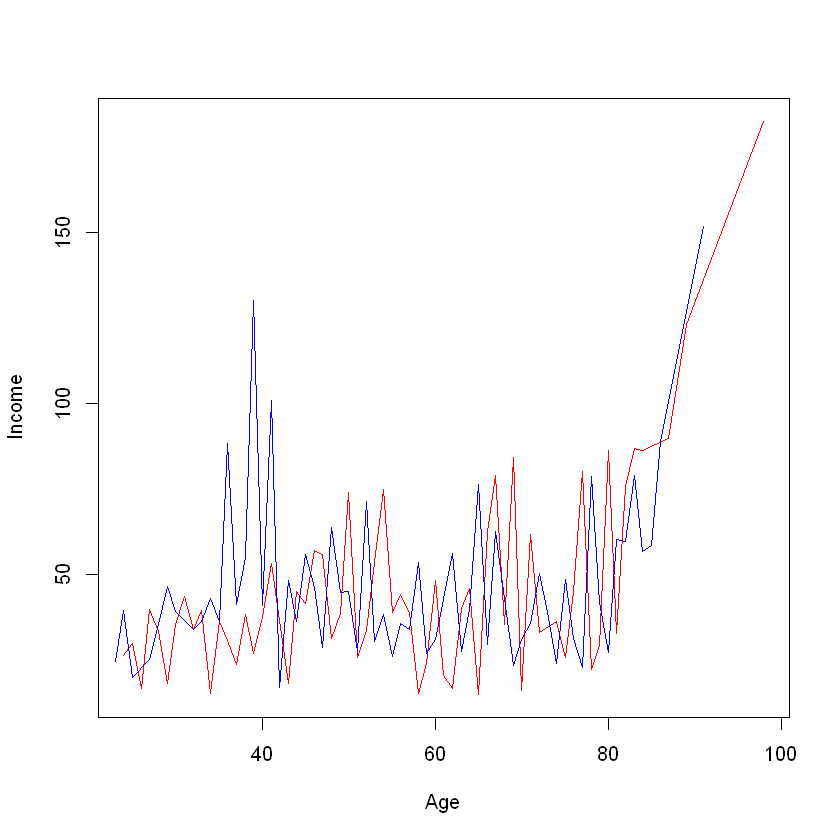
group_inc <- aggregate(Income ~ Age + Gender, data = Credit, mean)
m_data <- group_inc[group_inc$Gender == " Male", ]
nrow(m_data)
f_data <- group_inc[group_inc$Gender == "Female", ]
nrow(f_data)
with(m_data, plot(Age, Income, type = "l", col="red"))
with(f_data, lines(Age, Income, type = "l", col ="blue"))
63
62

cd <- Credit %>%
select(Income, Age, Gender) %>%
group_by(Age, Gender) %>%
summarize(Income = mean(Income))

m_data <- cd %>% filter(Gender == " Male")
nrow(m_data)

f_data <- cd %>% filter(Gender == "Female")
nrow(f_data)

with(m_data, plot(Age, Income, type = "l", col="red"))
with(f_data, lines(Age, Income, type = "l", col ="blue"))
`summarise()` has grouped output by 'Age'. You can override using the `.groups`
argument.
63
62
16.2 Refences
- dplyr: A Grammar of Data Manipulation on https://cran.r-project.org/.
- Data Transformation with splyr::cheat sheet.
- DPLYR TUTORIAL : DATA MANIPULATION (50 EXAMPLES) by Deepanshu Bhalla.
- Dplyr Intro by Stat 545. 6.R Dplyr Tutorial: Data Manipulation(Join) & Cleaning(Spread). Introduction to Data Analysis
- Loan Default Prediction. Beginners data set for financial analytics Kaggle